Our Technologies
Cadex’s has developed several technologies to rapid-test rechargeable batteries. The dedicated R&D team continues to enhance current methods and explore new ways.
The present and emerging technologies are:
There are three common methods to estimate battery capacity:
The present and emerging technologies are:
QuickSort™ |
Sorts single-cell Li-ion batteries into GOOD, LOW and POOR in 30 seconds. Classified pass/fail determines the usability in mobile phones and other devices. |
Spectro™ |
Based on multi-model electrochemical impedance spectroscopy (Spectro™), Spectro™ estimates the capacity, CCA and state-of-charge of lead acid batteries in 15 seconds with the help of a matrix. |
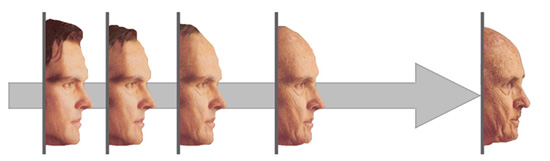
The unavoidable fact of aging
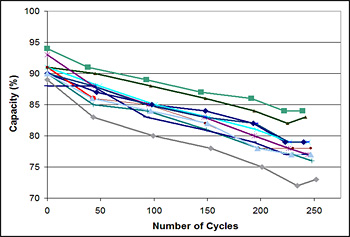 |
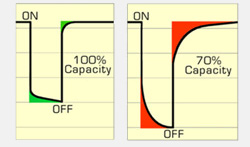
Batteries are often installed and forgotten. Capacity fade begins instantly and goes mostly unnoticed by the user. Few people know when to replace a battery. Li-ion provides 300–500 full discharge cycles; a capacity of 70–80% marks the end-of-life for most applications. Capacity is the leading health indicator. Cadex lab test. Capacity loss of 11 Li-ion mobile phone batteries when fully cycled. |
- Discharging a charged battery while tracking the elapsed time (Discharge method)
- Observing voltages, impedance and in-and-outflowing currents (Coulomb counting)
- Taking a snapshot of the electrochemical battery with frequency spectroscopy (EIS)
Rapid-test methods
|
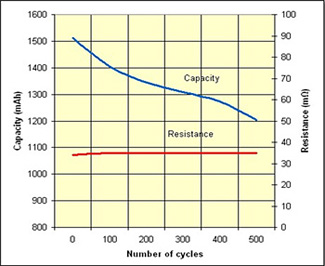
Rapid-testing is preferred but most testers only read voltage and internal resistance and are inaccurate. Batteries have improved; better electrolytes keep the internal resistance low. This makes resistive measurements obsolete. The chart illustrates capacity and resistance characteristics of Li-ion when cycling. Internal resistance cannot be used reliably to estimate capacity. Promoting features that lay outside the equipment’s capabilities confuses the industry into believing that multifaceted results are attainable with basic measurements. |
 |
The elements to battery rapid-testing lay in Time Domain and Frequency domain
|
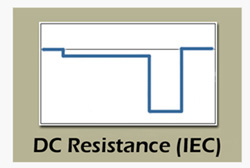
1. Time Domain using discharge pulses A two-tier load applies discharge currents according to IEC 61951-1:2005. The voltage drop provides the internal resistance. This method can be used for a wide range of batteries but capacity estimation is not possible. |
 |
| Electrochemical Dynamic Response works on attack and recovery. A speed of recovery relates to good ion flow in a healthy Li-ion. (QuickSort™ by Cadex) |
 |
|
2. Frequency Domain using frequency spectrum |
 |
Combining EIS with complex modeling (Spectro™)
 |
Cadex took EIS and developed multi-model electro-chemical impedance spectroscopy, or Spectro™. Spectro™ combines EIS with complex modeling to estimate battery capacity and improve CCA results. View our Spectro products. |
How Spectro™ works
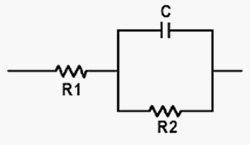
The battery is excited with a sinusoidal signal of 10mV or less. After filtering, the retrieved signal produces a Nyquist plot onto which various electrochemical models are superimposed. The algorithm finds the best match within given margins; non-fitting models are rejected. Data fusion correlates the values of key parameters to derive at capacity and CCA estimations. DSP technology shortens the computation of 40 million transactions to a mere 15 seconds.
1. Signal control and data acquisition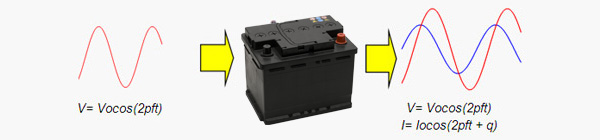 2. Filtering, phase and magnitude extraction  3. Modeling and statistical analysis Electrochemical models are fitted to the Nyquist plots  4. Data fusion Correlating values of key parameters to derive at capacity and CCA estimations  |
|
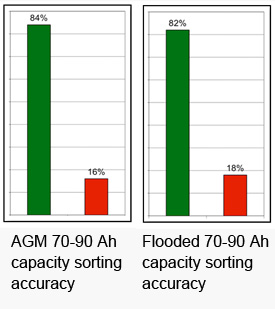
Test Results Excellent failure detection for AGM and flooded starter batteries (SLI) when tested with a Spectro CA-12 GA using a generic matrix (non-battery-specific)Test condition Batteries were charged and discharged according to EN-Norms. Results were compared with Spectro CA-12CCA accuracy +/-15% Standard Deviation; *Capacity sorting accuracy >80%* * Sorting accuracy is the ability to detect good and bad batteries. Based on capacity, Spectro CA-12 will classify >80% of good and bad batteries as good and bad respectively. |
 |
Battery Monitoring
|
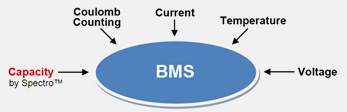
Starter batteries Sensors read battery voltage, current and temperature to estimate state-of-charge (SoC) and to detect anomalies.Conventional battery sensors perform well when the battery is new but lose accuracy with time as aging occurs. Loading conditions also play a role. Inaccuracies lead to false alarms. |
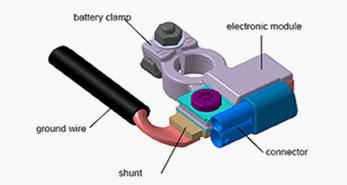 |
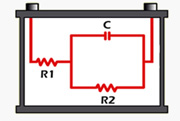
| Adding capacity converts a simple battery sensor to an advanced battery management system (BMS). EIS-BMS brings this closer to reality by adding the missing link, capacity. |
 |
| EIS-BMS may one day be mounted on the pole of a starter battery. (Not available today) |
 Conceptual Image |
|
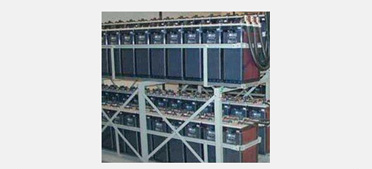
Stationary batteries Capacity measurement by discharging UPS batteries is seldom done, yet capacity determines the end-of-life. EIS-BMS promises to track capacity fade to establish a precise replacement protocol.Capacity-based monitoring needs a battery-specific matrix. A matrix is a lookup tables against which the battery is compared. |
 |
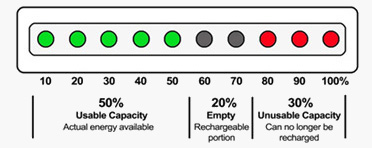
| With capacity and SoC known, the tri-state fuel gauge is possible that reveals the available energy, the empty portion and the dead part of a battery. This advances a BMS to state-of-function (SoF) level, a true snapshot of a battery. |
 |
SUMMARY
|
Battery testing seems to dwell in medieval times. The technology is complex and can be compared to the Indian tale in which blind men touch an elephant to learn the substance. Each man feels a different part of the body, compares notes, and disagrees at the end. Even sighted men struggle because there is no single measurement that can quantify the condition of a battery with certainty. A battery cannot be “measured.” Similar to the weather forecast, the symptoms can only be estimated with various degree of accuracy. |
 |